NIFTY 50 — 9 October 2026
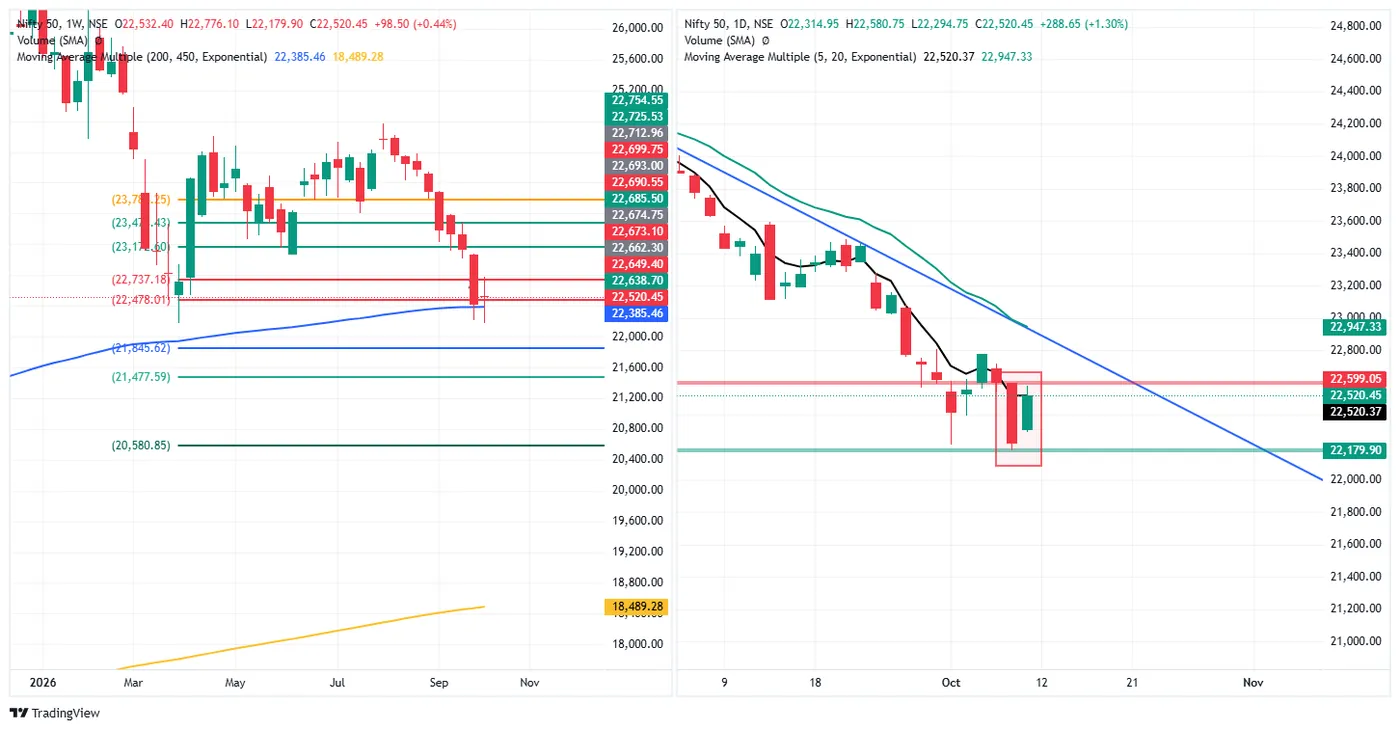
Close 22,520.45, up 288.65 (+1.30%), open 22,314.95, high 22,580.75, low 22,294.75. Friday opened 83.15 above Thursday's close of 22,231.80.
The week: +0.44% (+98.50), open 22,532.40, high 22,776.10, low 22,179.90, closing 57.1% of the way up a 596.20-point range.
A second test of the October low. The week's low of 22,179.90 went 37.40 below the 1 October low (22,217.30) and did not hold there: Friday closed 340.55 above it, at 78.9% of its own range. On the daily chart the 22,179.90 low is now a marked support line, and the two lows (1 and 9 October) sit within 40 points of each other.
The 200-week average. The weekly low went 205.56 below the 200-week EMA (22,385.46); the week closed 134.99 above it (0.60%). It is the first weekly close back above the 200-week line after a week that traded under it. The 450-week EMA is far below at 18,489.28.
Above. The daily mark at 22,599.05 is 78.60 overhead; Friday's high stopped 18.30 short of it. The daily falling trendline from early September and the 20-day EMA (22,947.33) run close together, 426.88 above the close (1.90%) (the trendline is read off the chart, not labelled). Weekly marks above: 22,737.18, then roughly 23,170, 23,470 and 23,780 (labels partly hidden by candles).
Below. Weekly marks at 22,478.01 (42.44 under the close), 21,845.62, 21,477.59 and 20,580.85.
Averages. The close is on the 5-day EMA (22,520.37, 0.08 apart).
SENSEX — 9 October 2026
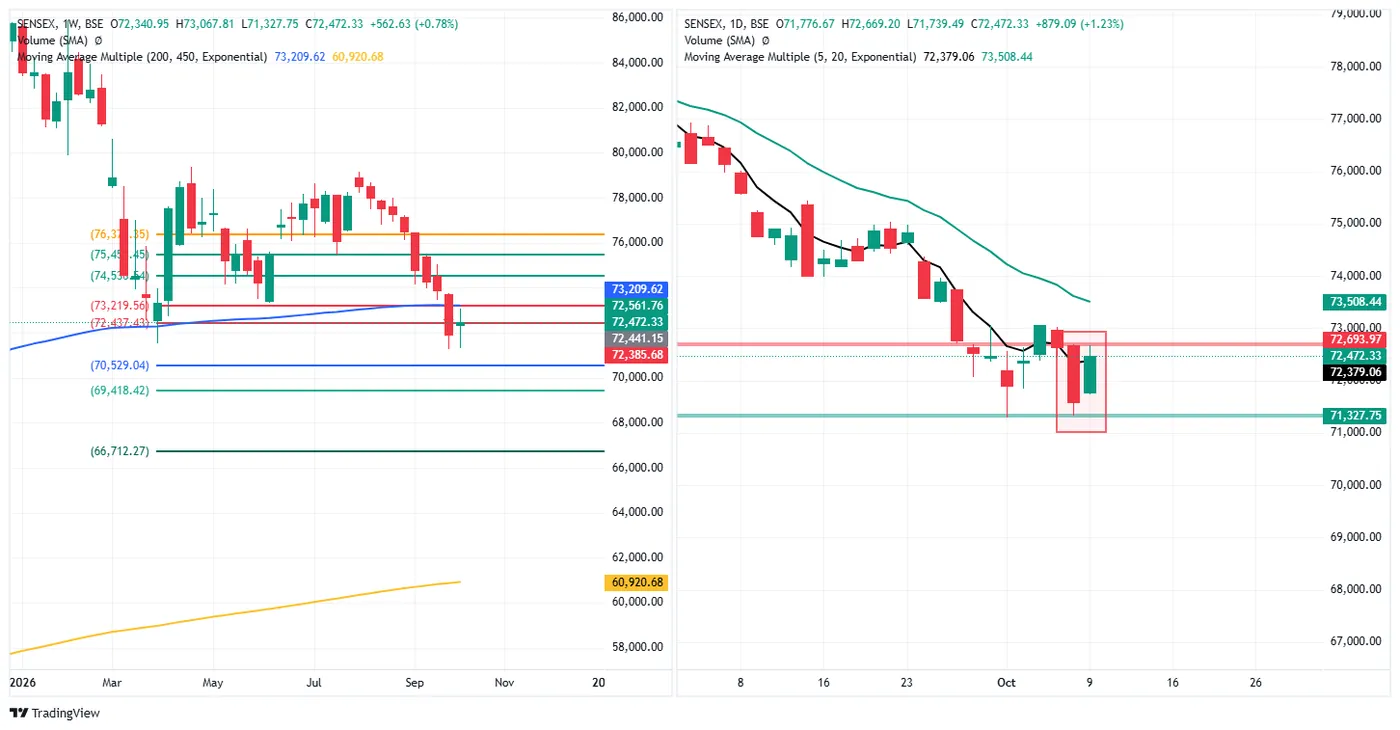
Close 72,472.33, up 879.09 (+1.23%), open 71,776.67, high 72,669.20, low 71,739.49. Opened 183.43 above Thursday's 71,593.24.
The week: +0.78% (+562.63), open 72,340.95, high 73,067.81, low 71,327.75, closing 65.8% up a 1,740.06-point range.
Same structure as the Nifty, with one difference. The week's low of 71,327.75 stayed 34.87 above the 1 October low (71,292.88) — a higher low, where the Nifty made a lower one. Friday closed at 78.8% of its range.
Below the 200-week average. The close is 737.29 below the 200-week EMA (73,209.62), 1.01%. The Nifty closed above its own 200-week line; the Sensex did not. Until both are on the same side, the two indices are giving different readings of the long-term average.
Daily range. Marked at 72,693.97 (221.64 above) and 71,327.75 (1,144.58 below). 20-day EMA 73,508.44, 1,036.11 above (1.43%); 5-day EMA 72,379.06.
Weekly marks. 72,437.43 (34.90 under the close), 73,219.56; above that roughly 74,530, 75,450 and 76,320. Below: 70,529.04, 69,418.42, 66,712.27.
BANK NIFTY — 9 October 2026
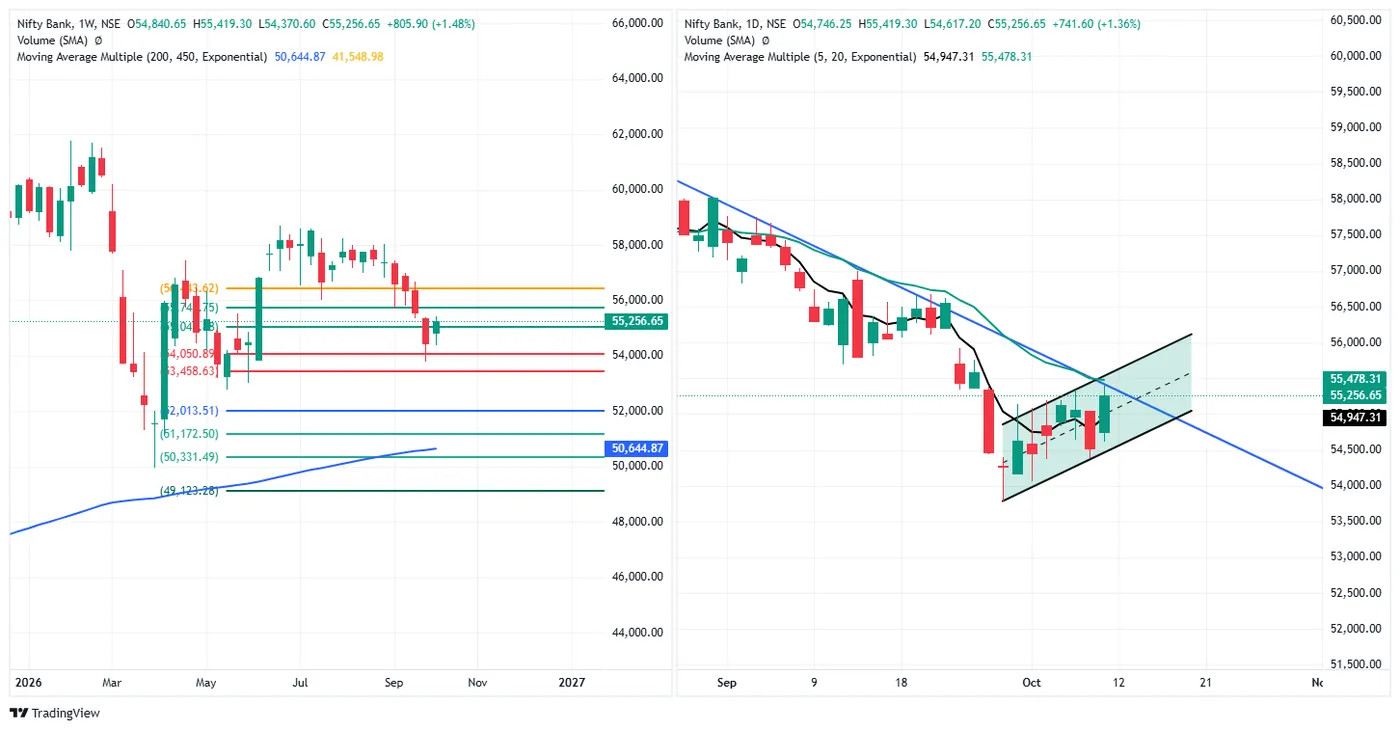
Close 55,256.65, up 741.60 (+1.36%), open 54,746.25, high 55,419.30, low 54,617.20. Thursday closed 54,515.05.
The week: +1.48% (+805.90), open 54,840.65, high 55,419.30, low 54,370.60, closing 84.5% up a 1,048.70-point range — the strongest weekly close position of the equity indices. Friday's high was also the week's high.
Higher lows since late September. The week's low was 584.90 above the previous week's 53,785.70. On the daily chart the lows since late September are drawn as a rising channel, and Friday closed in its upper half.
At the falling trendline. The descending trendline from August and the 20-day EMA (55,478.31) meet at this level. Friday's high stopped 59.01 below the 20-day EMA; the close is 221.66 below it (0.40%), the smallest gap of the equity indices. 5-day EMA 54,947.31.
Weekly marks. Above: roughly 55,040 and 55,745 (partly hidden), 56,443.62. Below: 54,050.89, 53,458.63, 52,013.51, 51,172.50, 50,331.49, 49,123.28.
Long-term. 4,611.78 above the 200-week EMA (50,644.87), 9.1%.
NIFTY FIN SERVICE — 9 October 2026
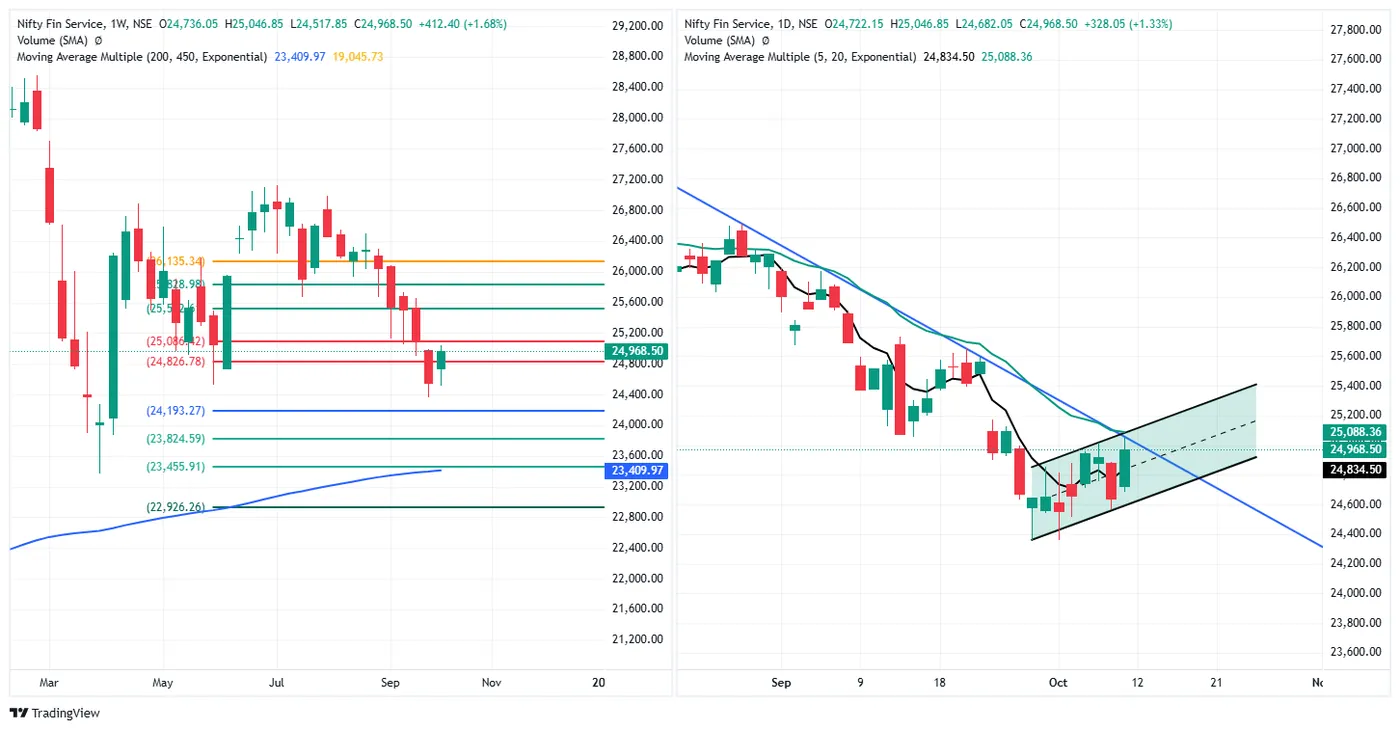
Close 24,968.50, up 328.05 (+1.33%), open 24,722.15, high 25,046.85, low 24,682.05. Thursday closed 24,640.45.
The week: +1.68% (+412.40), the largest weekly gain of the equity indices, closing 85.2% up a 529.00-point range (high 25,046.85, low 24,517.85).
Same structure as Bank Nifty. A rising channel from the late-September low, a falling trendline from August, and the two meeting at the 20-day EMA (25,088.36). Friday's high stopped 41.51 below it; the close is 119.86 below (0.48%). 5-day EMA 24,834.50.
Weekly marks. Close is between 24,826.78 (141.72 below) and roughly 25,086 (red, label partly hidden). Above: roughly 25,510, 25,829 and 26,135.34. Below: 24,193.27, 23,824.59, 23,455.91, 22,926.26.
Long-term. 1,558.53 above the 200-week EMA (23,409.97).
NIFTY MIDCAP SELECT — 9 October 2026
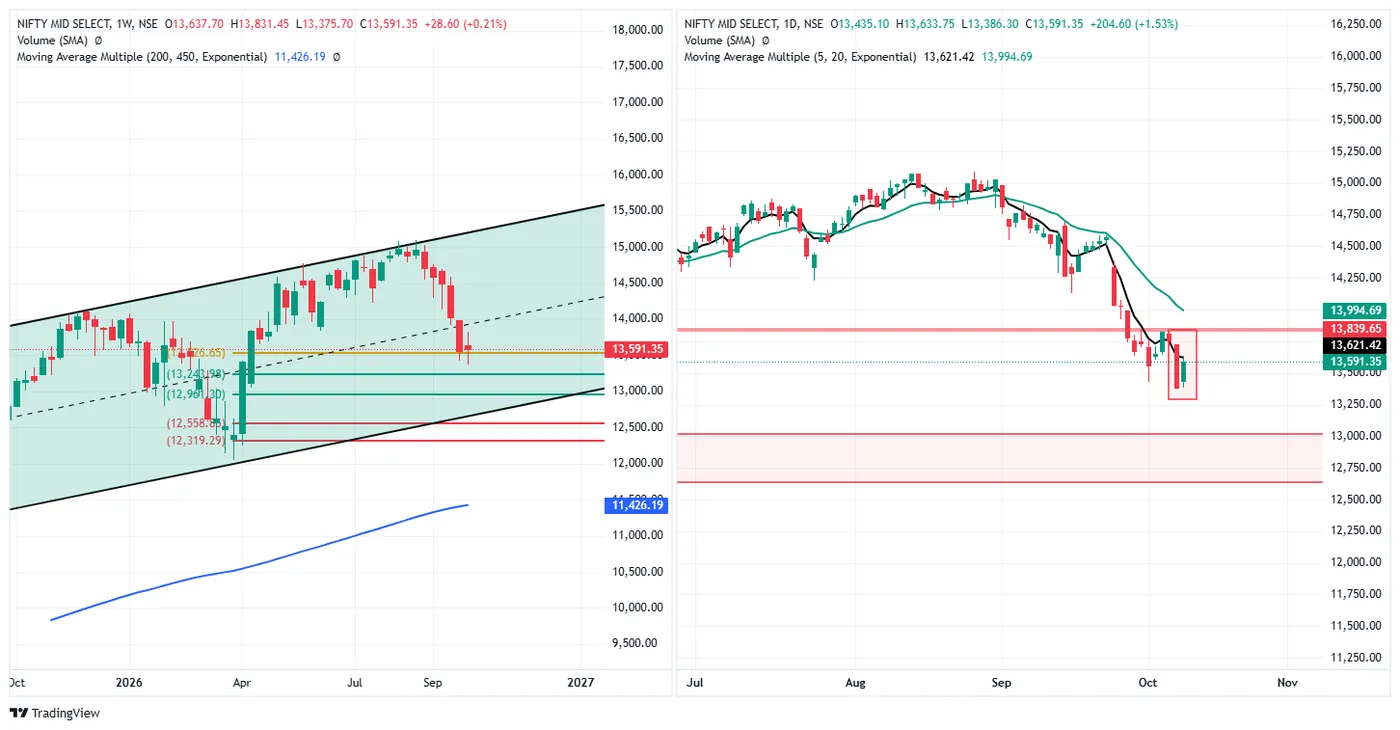
Close 13,591.35, up 204.60 (+1.53%), open 13,435.10, high 13,633.75, low 13,386.30. Thursday closed 13,386.75 after a large red candle.
The week: +0.21% (+28.60), the smallest weekly gain, closing 47.3% up a 455.75-point range (high 13,831.45, low 13,375.70) — the lowest weekly close position of the equity indices.
A new low, then a recovery. The week's low was 52.05 below the 1 October low (13,427.75). The week's high of 13,831.45 stopped 8.20 short of the daily mark at 13,839.65, which is now 248.30 above the close.
Averages. 30.07 below the 5-day EMA (13,621.42) and 403.34 below the 20-day (13,994.69), 2.97% — still the widest gap to the 20-day.
Weekly channel. Price remains inside the rising channel from 2025, in its lower half, sitting on the weekly mark near 13,577. Below: 13,243.98, 12,961.30, then 12,558.85 and 12,319.29. The shaded band on the daily chart, roughly 12,650–13,000, is the unfilled gap noted on 1 October; the channel's lower line also runs near 13,000.
INDIA VIX — 9 October 2026
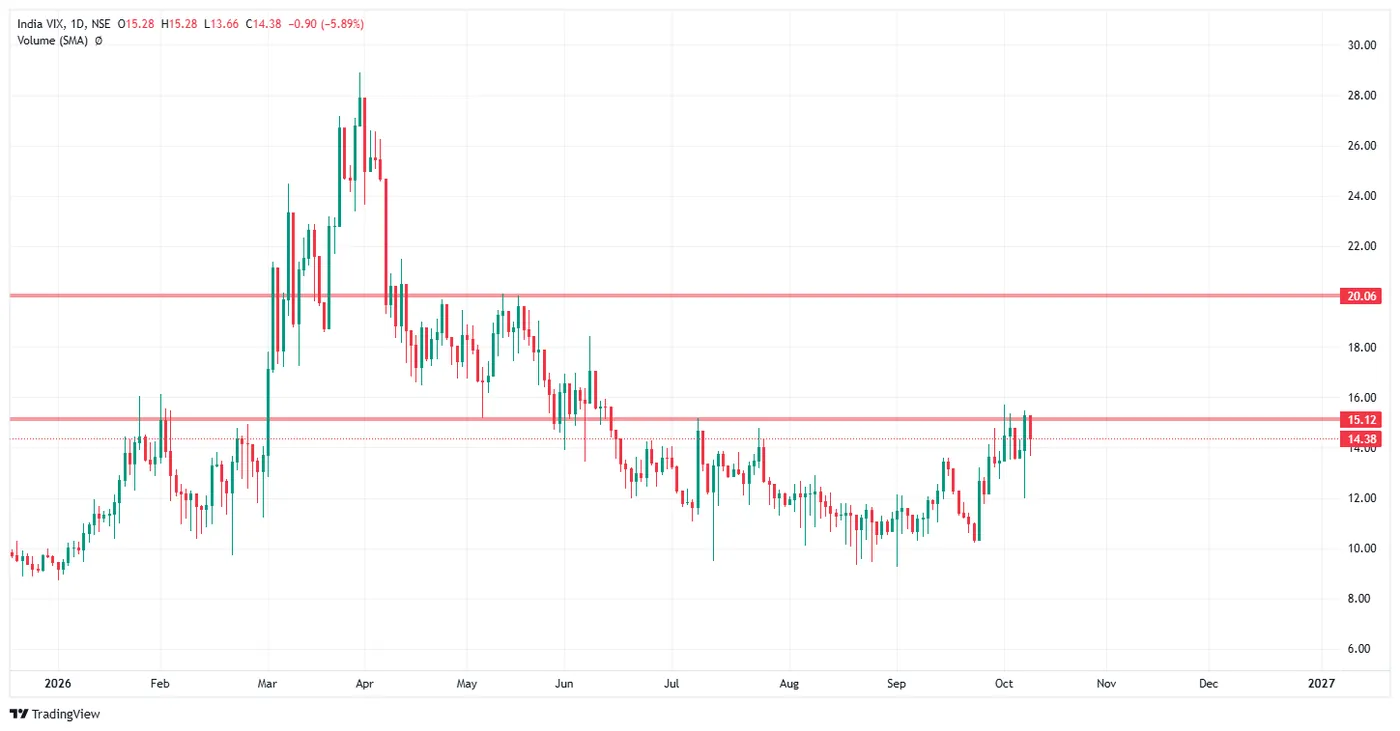
Close 14.38, down 0.90 (−5.89%), open 15.28, high 15.28, low 13.66.
Back under the band. The marked line at 15.12 is the level that capped the July spike and was the floor of the May–June range. VIX rose from around 10 in late September to trade above it in early October; Friday opened at 15.28 and closed 0.74 below it, the day's high being the open.
Context. Early-October candles carried long lower shadows (one reaching near 12), so the move higher was not one-way. The upper mark is 20.06, the April–May ceiling; the year's high was near 29 in late March.
Read with the indices. VIX fell 5.89% on a day all five equity indices rose more than 1.2%.
CRUDE OIL (MCX, 19 Oct fut) — 9 October 2026
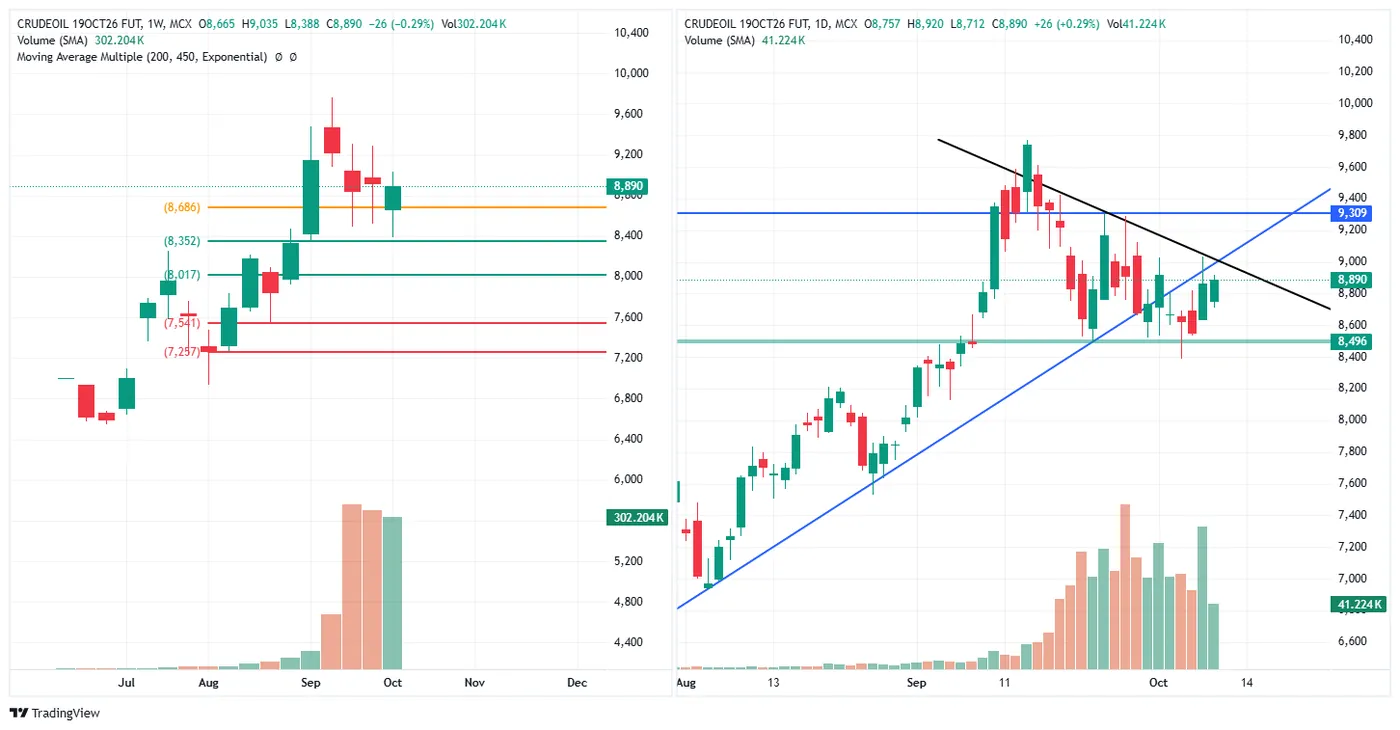
Close 8,890, up 26 (+0.29%), open 8,757, high 8,920, low 8,712. Volume 41.224K.
The week: −0.29% (−26), open 8,665, high 9,035, low 8,388. Weekly volume 302.204K.
Between two lines. The rising trendline from August was lost in early October and price now trades under it. A falling line from the September peak (about 9,750) runs near 8,950–9,000 at this point (read off the chart). Below, the horizontal mark at 8,496 (394 under the close): the week's low went 108 below it and the week closed back above.
Marks. Daily: 9,309 above (419 overhead), 8,496 below. Weekly: 8,686 (204 under the close), 8,352, 8,017, 7,541, 7,257.
Contract. The October contract expires on 19 October; volumes this week include rollover.
GOLD (MCX, 4 Dec fut) — 9 October 2026
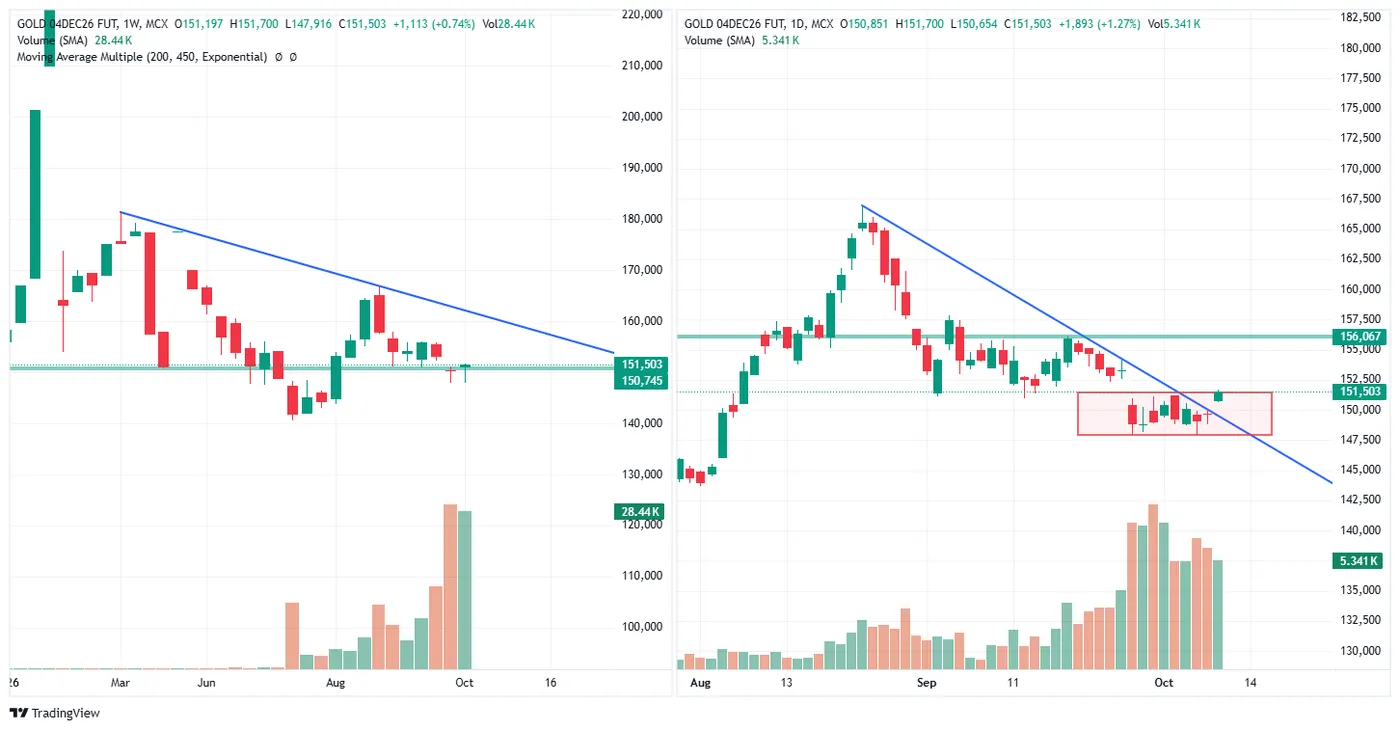
Close 151,503, up 1,893 (+1.27%), open 150,851, high 151,700, low 150,654. Volume 5.341K.
The week: +0.74% (+1,113), open 151,197, high 151,700, low 147,916. Weekly volume 28.44K.
Out of the two-week box. From late September price held a range of roughly 147,900–151,500 (shaded on the daily chart). Friday closed at its top, at 81.2% of the day's range, and above the daily falling trendline from the late-August peak near 167,000. The weekly mark at 150,745 is 758 below the close.
Above. The daily mark at 156,067 is 4,564 overhead (3.01%). The weekly falling trendline from the March high also runs in the 155,000–156,000 area (read off the chart), so the two sit close together.
SILVER (MCX, 4 Dec fut) — 9 October 2026
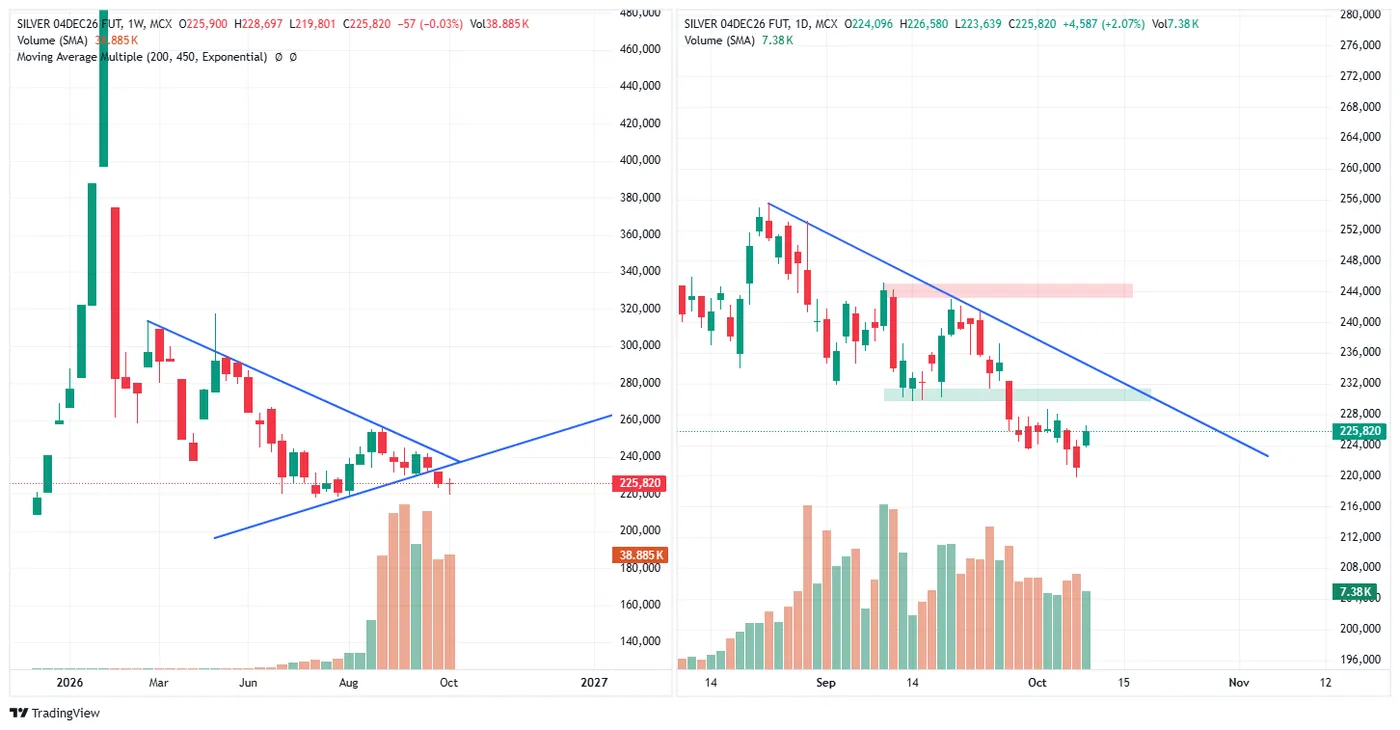
Close 225,820, up 4,587 (+2.07%), open 224,096, high 226,580, low 223,639. Volume 7.38K.
The week: −0.03% (−57), open 225,900, high 228,697, low 219,801. Weekly volume 38.885K.
Below the weekly triangle. On the weekly chart price broke under the rising lower line of a symmetrical triangle in late September and has stayed below it. Friday's bounce came from a week's low of 219,801.
Overhead on the daily chart. The shaded band at roughly 230,000–232,000 was support before the late-September drop; the close is about 4,200 below its lower edge. Above that, a second band near 243,000–245,000 and the falling trendline from the late-August high near 256,000.
Against gold. Gold closed above its falling trendline on Friday; silver remains below its triangle. The two metals are on opposite sides of their structures.
Read across the session
| Friday | Closed in its range | Week | Up its weekly range | |
|---|---|---|---|---|
| Gold (Dec) | +1.27% | 81.2% | +0.74% | 94.8% |
| Nifty Fin Service | +1.33% | 78.5% | +1.68% | 85.2% |
| Bank Nifty | +1.36% | 79.7% | +1.48% | 84.5% |
| Crude oil (Oct) | +0.29% | 85.6% | −0.29% | 77.6% |
| Silver (Dec) | +2.07% | 74.2% | −0.03% | 67.7% |
| Sensex | +1.23% | 78.8% | +0.78% | 65.8% |
| Nifty 50 | +1.30% | 78.9% | +0.44% | 57.1% |
| Nifty Midcap Select | +1.53% | 82.9% | +0.21% | 47.3% |
| India VIX | −5.89% |
Everything closed in the top quarter of Friday's range. All eight instruments rose on Friday and every one closed above 74% of its day's range; India VIX fell 5.89%.
The week sorted them differently. Bank Nifty and Fin Service had the largest weekly gains and closed at 84–85% of their weekly ranges. Gold closed at 94.8% of its weekly range, the highest on the page. Midcap Select gained 0.21% and closed below the middle of its week (47.3%), the only equity index to do so.
The October lows. The Nifty undercut its 1 October low by 37.40 and closed 340.55 above the week's low. The Sensex held 34.87 above its own 1 October low. Midcap Select undercut by 52.05. Bank Nifty's week's low was 584.90 above the previous week's.
At the 20-day average. Bank Nifty (0.40% below) and Fin Service (0.48%) are closest to their 20-day EMAs, where both meet their falling trendlines. The Nifty is 1.90% below, the Sensex 1.43%, Midcap Select 2.97%.
Metals split. Gold closed above its daily falling trendline; silver stayed below its weekly triangle.
What the institutional flow did
| FII net | DII net | Net | DII cover | |
|---|---|---|---|---|
| 5 Oct | −₹4,699.14 Cr | +₹5,181.62 Cr | +₹482.48 Cr | 1.10× |
| 6 Oct | −₹2,961.30 Cr | +₹5,088.92 Cr | +₹2,127.62 Cr | 1.72× |
| 7 Oct | −₹6,121.37 Cr | +₹4,596.57 Cr | −₹1,524.80 Cr | 0.75× |
| 8 Oct | −₹12,943.58 Cr | +₹10,703.11 Cr | −₹2,240.47 Cr | 0.83× |
| 9 Oct | −₹3,568.90 Cr | +₹4,743.26 Cr | +₹1,174.36 Cr | 1.33× |
| Week | −₹30,294.29 Cr | +₹30,313.48 Cr | +₹19.19 Cr | 1.00× |
Over the week, domestic buying matched foreign selling to within ₹20 Cr. FIIs sold on all five days; DIIs bought on all five. The previous week (28 Sep – 1 Oct, four sessions) ended at −₹1,510.77 Cr net, a 0.96× cover.
Thursday was the outlier. FII selling of ₹12,943.58 Cr on 8 October is the largest daily figure in the record shown here, above 30 September's ₹10,148.41 Cr. DIIs bought ₹10,703.11 Cr, the second-largest DII day after 30 September (₹11,271.73 Cr), and the session's net was −₹2,240.47 Cr. That was the day of the large red candle on the Nifty, Sensex and Midcap Select charts. Friday's FII selling was the week's smallest but one (₹3,568.90 Cr).
F&O positioning
FII net position by segment, in contracts (calls long and puts short count as long; puts long and calls short as short):
| 1 Oct | 5 Oct | 6 Oct | 7 Oct | 8 Oct | 9 Oct | Change since 1 Oct | |
|---|---|---|---|---|---|---|---|
| Index futures | −310,174 | −302,391 | −293,725 | −298,285 | −307,109 | −293,988 | +16,186 |
| Index options | −1,098,043 | −954,046 | −915,250 | −974,744 | −1,070,361 | −887,310 | +210,733 |
| Stock futures | +535,081 | +566,988 | +610,497 | +580,702 | +609,846 | +675,468 | +140,387 |
| Stock options | −231,763 | −248,210 | −238,649 | −268,593 | −311,299 | −279,854 | −48,091 |
| Net | −1,104,899 | −937,659 | −837,127 | −960,920 | −1,078,923 | −785,684 | +319,215 |
The FII book is less short than a week earlier, by 319,215 contracts. Most of that is index options (+210,733) and stock futures (+140,387). Stock-futures longs reached 675,468, the largest in this table, on Friday.
Index futures barely moved. The net short narrowed by 16,186 contracts over the week and is still −293,988. Thursday's heavy cash selling came with index futures going 8,824 more short that day; Friday reversed 13,121 of it.
Index options swing with expiries, so day-to-day changes there are partly positions expiring rather than new ones; the week's direction is the more useful reading.
Clients sit on the other side, as usual: net long 5,294,513 contracts across the four segments on Friday.
The standing limits apply: these are net figures across all participants in a category, one week is not a rule, and positions published after the close cannot have caused the candles that produced them.
Descriptive commentary on price structure and marked levels. It is not advice, not a recommendation, and contains no targets or entry levels. NEOGreeks is not a SEBI-registered investment adviser.